

|
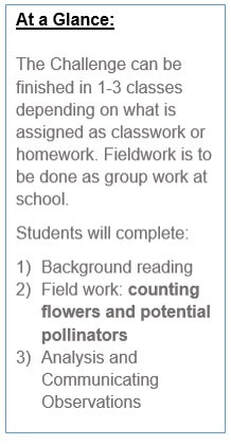
INTRODUCTIONEveryone makes observations whether they realize it or not. The stove is hot. The sky is cloudy. We often make everyday observations with our senses and describe them with words. Scientists make observations too, but they use numbers to measure and quantify. In short: scientists count. In this activity students will use a common scientific tool for counting flowers, potential pollinators and determine if there is a relationship between the two sets of numbers. Question being answered: do more flowering plants mean more pollinators
materials- 24-30 feet of string, provided (in physical kit)
- 5-6 rulers, 1 per group - scissors, 1 pair per group - copies of background reading and comprehension - copies of provided data and analysis sheets |
Preparation
- Prior to field work the teacher must decide which areas of the school yard or adjacent green spaces will be used. Ideally the activity will be done in an area that has not been mowed in several days, but is not so overgrown that the string quadrat is hard to see. Don’t be concerned if at first glance flowers do not seem abundant. Note that wild flowers/ flowering weeds aren’t always large and immediately noticeable. Chances are there are more present than it seems.
- Have students complete background reading activity in packet.
- Break students into groups of 4 or 5.
- Students will cut and use 4 pieces of equal sized string to define a square (scientists call this tool a quadrat) once outside. Enough string has been included with your kit for up to 5 groups to cut 4, 2ft pieces. (Not enough rulers for the class? Cut several 2ft pieces of string as guides!)
- Have students in the classroom practice using their 4 pieces of string to create a square quadrat. Explain they should take care not to walk through their quadrat. Once they are outside they will sit around the edges of the quadrat to make observations.
field work
- Groups should have their 4 pieces of string, and each student their data sheet and something to write with. Instruct students that this is a silent activity during the observation period. Noise and quick movements could influence animal behavior (e.g., insects might avoid noisy, disturbed areas).
- Assign each group an area to set up their quadrat.
- Teachers should call to the class to “start” and “stop” observing as a group.
- During the 5-7 minutes observation period students should count any potential pollinators that fly through their quadrat towards flowers in their quadrat, travel (walking/crawling) onto a flowering plant or land on a flowering plant in their quadrat. They can use a tally method.
- After the observation time is over students should record as accurately as possible the number of flowers in their quadrat.
Analysis, Discussion and Extensions
- Each student has observed 2 numbers while outside (number of flowers, number of potential pollinators). These two numbers represent one x and one y coordinate. These (x,y) coordinate pairs will be used as instructed on the guided analysis sheet to make a graph (for 6th and up, a scatter plot).
- Note that because students worked in groups, most likely there will be clusters of points on the graph. This is ok. You are looking for the presence/absence of a trend.
- Using the Extensions Road Map, what questions might be asked next, if any?
- Have groups write-up or create an oral presentation summarizing their observations, conclusions and any future questions that could be answered.